^v^ ^v^ ^v^

QQQQ Overview
The NASDAQ 100 Index, a technology sector-weighted, non-financial sector index, is traded as the Powershares ETF QQQQ. QQQQ is up +0.91% for the week, down -0.22% for the month, down -0.55% for the year, but still up an amazing +76.77% since the March 9, 2009 market bottom. In addition, QQQQ is down -9.94% from the April 23, 2010 YTD closing high of 50.52. QQQQ, along with the Russell 2000 ETF "IWM", are leading market indicators. IWM and QQQQ have led the S&P 500 and Dow Jones Industrials 30 upwards since the March 2009 market bottom.
The QQQQ has not set a new YTD low so far. The 2010 YTD closing low was 42.62 on February 4. During this current pullback, the low has been 43.82 on on June 9. The S&P 500 in particular did set a new 2010 YTD closing low on June 7. So QQQQ has been outerforming the overall market.
Economic and Market News
A review and weekly update of USA and World market and economic news and fundamental analysis is here. Overall, the USA and global economic data remains cautiously optimistic.
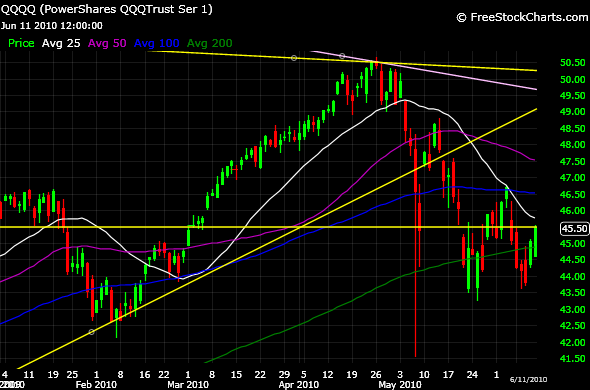
QQQQ Daily Chart
Below is the QQQQ daily chart for 2010.
Noteworthy Closing Prices on Daily Chart below:
Current Close 45.50 (Yellow horizontal line)
YTD 4-23-10 High 50.52
YTD 2-4-10 Low 42.62
YE 12-31-09 45.75
10 Month EMA 44.44
QQQQ: Testing 200 Day Moving Average
Intermediate-Term Trend
The intermediate-term signal, the comparison of the 25 day and 50 day simple moving averages, signalled a bear market for QQQQ on Friday, May 21, which still remains intact. That is, the 50d sma is greater than the 25d sma. An intermediate term bull market had previously been in effect since March 15.
Resistance
The current closing price, the yellow horizontal line, has pulled back from the April 23 YTD high of 50.52, a -9.94% decrease. There are now multiple levels of recent resistance above, including May 27 peak of 45.87 plus the late December 2009 and January 2010 peaks and topping action in the 46.00 range. Higher above, the benchmark price of 50.00 has had a lot of price interaction as short, intermediate, and long term resistance.
Support
QQQQ is at the very early March 20010 trading area. The 200d sma has been the key support, and test, for QQQQ. QQQQ has been testing the 200d since May 20 and is currently above. There are multiple levels of support below, including the February 18 peak closing high of 44.85. There is also long term support from the June through early August 2008 sideways trading range, where QQQQ is trading about in the middle of presently. However, with the recent price volatility, support may be tenuous.
Moving Averages
QQQQ is below the 25, 50, and 100 day simple moving averages and has tested the 200d sma twice since May 20. QQQQ is now just above the 200d sma. The 25d sma is descending and below the 50d and 100d sma's. The 50d and 100d sma's are descending, yet the 200d sma continues to ascend.
Uptrend Line
The yellow uptrend line, a rate of price ascent, is from the March 9. 2009 closing low of 25.74 up through the February 4, 2010 closing low of 42.62. The February 4 closing low was the bottom of the previous 2010 pullback and continues as the YTD closing low. QQQQ plunged downwards through this uptrend line on Flash Crash Thursday, May 7. QQQQ has now remained below since Friday, May 14.
Downtrend Line
The yellow downtrend line, a rate of price descent, is from the October 31, 2007 peak closing high of 55.03 down through the April 23, 2010 closing high of 50.52, the peak YTD closing high so far. QQQQ has remained below this downtrend line.
Long Term Downtrend Line
The lavender downtrend line, a rate of price descent, is from the March 27, 2000 all-time adjusted closing high of 114.30. QQQQ has remained well below this downtrend line.
Relative Strength Index (RSI)
RSI 14 day = 53.61 reasonable and higher than the recent 27.99 low on May 7
RSI 28 day = 39.95 is marginally oversold and higher than the recent 35.33 low on May 25
The RSI 14 day is reasonable, but the 28 day indicates marginally oversold conditions.
MACD (12,26,9)
The MACD flipped to bullish on June 11. However, the MACD has been staying near the neutral (0.00) line and alternately signalling bullish or bearish.
Long-Term Trend
The 10 month exponential moving average of 4.44 is a long-term indicator. That is the line in the sand, so to speak, for the long term signal of a bull or bear market. QQQQ continues above this indicator which signals a long-term bull market. QQQQ has remained above since April 2009.
Conclusion
QQQQ set a 2010 YTD high on April 23 and then was pulled down by the overall market downdraft. The overall market has been volatile, so high beta QQQQ is bouncing up and down accordingly. The technology sector Q1 revenues, earnings, and outlook were been very good. I remain bullish on QQQQ in 2010 and still predict there will be more 2010 YTD highs. The RSI 14d is reasonable and the 28d indicates marginally oversold conditions. The MACD is hovering around the neutral signal. The intermediate-term trend remains bearish and the long-term trend remains tenuously bullish.
QQQQ Monthly Chart
Below is the monthly QQQQ chart since January 2005 for a long-term perspective. The overall analysis and commentary are the same as for the daily chart above. The yellow horizontal line, the current price, plus the yellow downtrend and uptrend lines and the lavender downtrend line are the same, and as described, on the daily chart above. The white moving average line is the 10 month exponential moving average, which is the long-term bull or bear market signal, as discussed above with the daily chart.

QQQQ ETF Portfolio Holdings
The NASDAQ 100 Index includes 100 of the largest domestic and international nonfinancial companies listed on the Nasdaq Stock Market based on market capitalization. The QQQQ will, under most circumstances consist of all the stocks in the Index. The QQQQ portfolio is rebalanced quarterly and reconstituted annually.. The Powershares QQQQ portfolio holdings are here. QQQQ is heavily weighted to the Information Technology sector (62.71%), then Consumer Discretionary (15.23%), then Health Care (14.91%). Those 3 sectors comprise 92.85% of the entire portfolio. Therefore, the QQQQ is a tech weighted, nonfinancial Index and related ETF. Also, Apple Inc., AAPL, is the most heavily weighted stock in QQQQ at 18.88% and is reviewed in detail here.
Disclosure
We are long AAPL which is in the QQQQ portfolio, but do not have any long or short position in QQQQ stock.
^v^ ^v^ ^v^

No comments:
Post a Comment