Pages

Friday, July 23, 2010

They Just Don't Get Microsoft! (Video)

^v^ ^v^ ^v^


Microsoft market capitalization is 3rd largest in USA at $226.19B, behind Exxon ($280.57B) and Apple ($237.47B). This makes MSFT the 2nd largest technology company in USA behind Apple and ahead of IBM, Google, Cisco, Oracle, Intel, Hewlett-Packard.


What's the Knock On Microsoft CEO Steve Ballmer? Nothing!

Microsoft (MSFT) reported an excellent Q2 for revenues, net profit, and net profit margin. Before the Q2 financial results, some of the media were saying there was a  potential corporate coup to oust CEO Steve Ballmer. Forget that! Microsoft is still doing great with record numbers reported for Q2.

Even though Apple surpassed Microsoft in market capitalization in late May to become the largest tech company in the USA by this measure, Microsoft still has the numbers to be the Tech King. Microsoft topped Apple in 2010 Q2 on Revenues $16.04B vs $15.70B, Net Profit $4.52B vs $3.25B, and Net Proft Margin 28.2% vs 20.7%. Maybe Apple will pass Microsoft at some point on Revenues, but Microsoft's Net Profit Margin should keep Microsoft comfortably ahead on Net Profits for some time to come.


WESTCHESTER COUNTY, N.Y. -- Marek Fuchs, TheStreet's media critic, manhandles the ginned up controversy over Microsoft's CEO.


Follow OspreyFlyer on Twitter!


^v^ ^v^ ^v^

Sunday, July 18, 2010

NASDAQ 100 Breaks Down Below 200 Day Average (Charts)

^v^ ^v^ ^v^


NASDAQ Building at Times Square


QQQQ Overview
QQQQ closed the week at $44.34 as it  broke down through the 200 day simple moving average on Friday, July 16. QQQQ is down -0.63% for the week, up +3.82% for the month, down -3.08% for the year, but still up an amazing +72.26% since the March 9, 2009 market bottom. In addition, QQQQ is down -12.23% from the April 23, 2010 YTD closing high of 50.52.

The NASDAQ 100 Index, a technology sector-weighted, non-financial sector index, is traded as the Powershares ETF QQQQ. Apple, AAPL, is a material 19.13% of the QQQQ portfolio listed here. Apple Inc. stock, AAPL, and news is reviewed here. More information about QQQQ is at the end of this post..

Economic and Market News
A review and weekly update of USA and World market and economic news and fundamental analysis is here. The IMF issued a partial update of their semi-annual World Economic Outlook as of June 30 which is reviewed here. The full semiannual World Economic Outlook issued in April is reviewed here. In summary, the IMF sees the world economic recovery continuing. Sentiment is "cautiously optimistic" perhaps leaning to "extremely cautious optimism" about the global recovery but it appears a second half 2010 slowdown is in progress for the world and the USA.


QQQQ Breaks Down Below 200 Day Average

QQQQ Daily Chart Below is the QQQQ daily chart for 2010. A monthly chart is included at the bottom of this page for a broader perspective.

Noteworthy Closing Prices on Daily Chart Below
Current Close $44.34 (Yellow horizontal line)
YTD 4-23-10 High $50.52
YTD 7-2-10 Low $42.47
YE 12-31-09 $45.75
10 Month EMA $44.01


Intermediate-Term Trend The intermediate-term signal, the comparison of the 25 day and 50 day simple moving averages, signalled a bear market for QQQQ on Friday, May 21, which still remains intact. That is, the 50d sma is greater than the 25d sma. An intermediate term bull market had previously been in effect since March 15.

Resistance QQQQ broke down through the 25, 50, and 200 day simple  moving averages on Friday, July 16. These prices are 45.01, 45.41, and 45.33,  respectively. The 50d and 200d sma's are now key recent resistance. The current closing price, the yellow horizontal line, has pulled well back from the April 23 YTD high of 50.52, a -11.68% decrease. There are now multiple levels of recent resistance above. Much higher above, the benchmark price of 50.00 has had a lot of price interaction as short, intermediate, and long term resistance.

Support Nearest critical support  is the June 9 trough of 43.82. If this support fails, then the next notable and strongest support below are the previous and new 2010 YTD closing lows of 42.62 and 42.47 on February 4 and July 2, respectively. That's the absolute bottom and ultimate support or a major breakdown may occur.

Moving Averages QQQQ is now below the 25, 50, 100, and 200 day simple moving averages - all the averages on the daily chart above. The 25d sma is descending and below the 50d, 100d, and 200d sma's. The 50d is descending sharply and crossed below the 100d sma, a Death Cross, on June 30. The 50d should cross below the 200d sma, another Death Cross in the next few trading days. The 100d and 200d have leveled off. These sma's are developing into a bearish fan if QQQQ does not rally significantly - soon.

Highest Uptrend Line The highest yellow uptrend line, a rate of price ascent, is from the March 9. 2009 closing low of 25.74 up through the February 4, 2010 closing low of 42.62. The February 4 closing low was the bottom of the early and previous pullback in 2010 and was the 2010 YTD closing low at that time. QQQQ plunged downwards through this uptrend line on Flash Crash Thursday, May 7. QQQQ has now remained below since Friday, May 14.

Middle Uptrend Line The middle yellow uptrend line, a rate of price ascent, is from the March 9, 2009 closing low of 25.74 up through the June 9, 2010 closing low of 43.82. The June 9 closing low had been the bottom of this most recent pullback until June 29 when QQQQ gapped down below. QQQQ broke down through this trendline on Friday, July 16.

Lowest Uptrend Line The lowest yellow uptrend line, a rate of price ascent, is from the March 9, 2009 closing low of 25.74 up through the July 2, 2010 closing low of 42.47, the 2010 YTD closing low. QQQQ rallied on July 6, the next trading day, and has stayed above this trendline henceforth.

Downtrend Line The yellow downtrend line, a rate of price descent, is from the October 31, 2007 peak closing high of 55.03 down through the April 23, 2010 closing high of 50.52, the peak YTD closing high so far. QQQQ has remained below this downtrend line subsequently.

Long Term Downtrend Line The lavender downtrend line, a rate of price descent, is from the March 27, 2000 all-time adjusted closing high of 114.30 down through the April 23, 2010 closing high of 50.52, the peak YTD closing high so far. QQQQ has remained well below this downtrend line subsequently.

Relative Strength Index (RSI)
RSI 14 day = 43.53 is leaning oversold and higher than the YTD low of 9.31 on July 6
RSI 28 day = 50.28 is reasonable and higher than the YTD low of 35.45 on June 9
Both the RSI 14 and 28 day are off the YTD lows with plenty of upside (and downside).

MACD (12,26,9) The MACD flipped to bullish on July 12 but is now downtrending. MACD at +0.36 on June 18 had been the highest since July 24, 2009 at +.37.

Volume QQQQ traded 98.8M shares on Friday, July 16. The 20 day moving average is approximately 91.5M. Volume is reasonable, not as high as some periods in 2010 but not as low either. 

Long-Term Trend The 10 month exponential moving average of 44.01 is a long-term indicator and shown on the monthly chart below. That is the line in the sand, so to speak, for the long term signal of a bull or bear market. QQQQ dipped below in June but now has rallied back above. QQQQ had previously remained above since April 2009.

Conclusion QQQQ set a 2010 YTD high on April 23 and then was pulled down by the overall market downdraft caused initially by the European Crisis and then the recent disappointing USA economic data and GDP projections. Q2 earnings season  began this  last week  and the technology sector so far has been good, not great. The technology sector Q1 revenues, earnings, and outlook were very good.

I am changing from "cautiously bullish" to "extremely cautuiously bullish' on QQQQ in 2010 and now am not sure there will be any further  2010 YTD highs. It appears both the USA and World are experiencing an economic slowdown in the second half of  2010 and may well slow down further in 2011. I  do not think the technology sector will be as negatively impacted as other sectors. but the overall market will keep QQQQ down as well. Both the RSI 14d and 28d are above the YTD lows. The MACD is bullish but downtrending. The intermediate-term trend continues bearish as significant price damage has occurred on this pullback. The long-term trend continues tenuously bullish but this could well change to bearish.


QQQQ Monthly Chart

Below is the monthly QQQQ chart since January 2005 for a long-term perspective. The overall analysis and commentary are the same as for the daily chart above. The yellow horizontal line, the current price, plus the yellow downtrend and uptrend lines and the lavender downtrend line are the same, and as described, on the daily chart above. The white moving average line is the 10 month exponential moving average, which is the long-term bull or bear market signal, as discussed above with the daily chart.


QQQQ ETF Portfolio Holdings
The NASDAQ 100 Index includes 100 of the largest domestic and international nonfinancial companies listed on the Nasdaq Stock Market based on market capitalization. The QQQQ will, under most circumstances consist of all the stocks in the Index. The QQQQ portfolio is rebalanced quarterly and reconstituted annually.. The Powershares QQQQ portfolio holdings are here. QQQQ is heavily weighted to the Information Technology sector (63.20%), Consumer Discretionary sector (14.55%), and Health Care sector (14.89%). Those 3 sectors comprise 92.64% of the entire portfolio. Therefore, the QQQQ is a Technology sector weighted, nonfinancial Index and related ETF with significant holdings in Consumer Discretionary and Health Care stocks. Also, Apple Inc., AAPL, is the most heavily weighted stock in QQQQ at 19.13% and is reviewed in detail here.


Disclosure
We are long AAPL which is in the QQQQ portfolio, but do not have any long or short position in QQQQ stock.


Follow OspreyFlyer On Twitter!


^v^ ^v^ ^v^

Wednesday, July 14, 2010

They Just Don't Get Intel! (Video)

^v^ ^v^ ^v^


Intel market capitalization is 22nd largest in USA at $118.85B
This makes Intel the 7th largest technology company in USA behind: Apple, Microsoft, IBM, Google, Cisco, Oracle


Is Intel's Strong Outlook, Raised Guidance Credible?

Intel (INTC) reported a blockbuster Q2 for earnings, margins, and profits. Intel called it their best quarter ever. "Strong demand from corporate customers for our most advanced microprocessors helped Intel achieve the best quarter in the company's 42-year history," Intel president and CEO Paul Otellini said.

Intel then went on to raise guidance and predict strong results in the future. CEO Ortellini said, "Intel growth continues to run ahead of economic growth, reflecting what we believe is a fundamental shift driven by Internet adoption" and "As internet traffic continues to boom, the cloud build-out is accelerating in order to keep pace" which means more Intel processors.

Is the strong outlook credible? Is CEO Paul Otellini realistic with his optimistic vision of the future? Marek Fuchs argues that  Otellini was honest in predicting an Intel downturn at the onset of the recession and is one of the more credible CEOs in America.


DEER ISLE, MAINE -- Marek Fuchs, TheStreet's media critic, fills in the other half of the Intel story.


Follow OspreyFlyer on Twitter!


^v^ ^v^ ^v^

Sunday, July 11, 2010

NASDAQ 100 Rallies Off Low! (Charts)

^v^ ^v^ ^v^


NASDAQ Building in New York City


QQQQ Overview
QQQQ barely set a 2010 YTD closing low on July 2 of 42.47, the previous YTD closing low was 42.62 on February 4. So the February 4 low acted as support and QQQQ bounced up and gained for the last 4 trading days, which is encouraging. QQQQ closed this week, July 9,.at 44.62.

QQQQ is up +5.06% for the week, up +4.47% for the month, down -2.47% for the year, but still up an amazing +73.35% since the March 9, 2009 market bottom. In addition, QQQQ is down -11.68% from the April 23, 2010 YTD closing high of 50.52. QQQQ, along with the Russell 2000 ETF "IWM", are leading market indicators. IWM and QQQQ have led the S&P 500 and Dow Jones Industrials 30 upwards since the March 2009 market bottom.

The NASDAQ 100 Index, a technology sector-weighted, non-financial sector index, is traded as the Powershares ETF QQQQ. Apple, AAPL, is a material 19.76% of the QQQQ portfolio. Apple Inc. stock, AAPL, and news is reviewed here. QQQQ has been outperforming the overall market, the S&P 500, the same as Apple has.

Economic and Market News
A review and weekly update of USA and World market and economic news and fundamental analysis is here. Sentiment is "cautiously optimistic" about the global recovery. Asia-Pacific is the most robust economic region while there is uncertainty about Europe's sovereign debt, financial system, and economic recovery. USA leading economic indicators are signalling the recovery is slowing down, perhaps even stalling. USA unemployment and underemployment remains high, bank lending continues to contract, housing starts have plunged, durable goods orders are down, and the Q1 GDP was unexpectedly revised downwards.
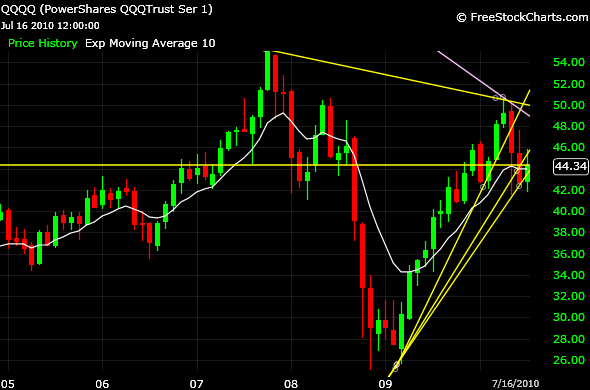
QQQQ Daily Chart
Below is the QQQQ daily chart for 2010. A monthly chart is included at the bottom of this page for a broader perspective.

Noteworthy Closing Prices on Daily Chart Below
Current Close $44.62 (Yellow horizontal line)
YTD 4-23-10 High $50.52
YTD 7-2-10 Low $42.47
YE 12-31-09 $45.75
10 Month EMA $44.06


QQQQ Rallies Off Low!


Intermediate-Term Trend
The intermediate-term signal, the comparison of the 25 day and 50 day simple moving averages, signalled a bear market for QQQQ on Friday, May 21, which still remains intact. That is, the 50d sma is greater than the 25d sma. An intermediate term bull market had previously been in effect since March 15.

Resistance
The current closing price, the yellow horizontal line, has pulled well back from the April 23 YTD high of 50.52, a -11.68% decrease. There are now multiple levels of recent resistance above, including the January 27, February 18, and May 21 subpeaks of 44.70, 44.85, and 44.84,  respectively. If this resistance can be overcome, the next resistance is the 200 day simple moving average at 45.25. If the 200d sma could be regained, an upside breakout would probably occur and QQQQ has a relatively clear run up to the lower 45.50+ area and the 50d sma at 45.82. Higher above, the benchmark price of 50.00 has had a lot of price interaction as short, intermediate, and long term resistance.

Support
The most notable and strongest support below are the previous and new 2010 YTD closing lows of 42.62 and 42.47 on February 4 and July 2, respectively. That's the bottom and ultimate support or a major breakdown may occur.

Moving Averages
QQQQ is now below the 25, 50, 100, and 200 day simple moving averages. The 25d sma is descending and below the 50d, 100d, and 200d sma's. The 50d is descending and crossed below the 100d sma, a Death Cross, on June 30. The 100d and 200d sma's have leveled off. These sma's are developing into a bearish fan if QQQQ does not rally significantly.

Higher Uptrend Line
The higher yellow uptrend line, a rate of price ascent, is from the March 9. 2009 closing low of 25.74 up through the February 4, 2010 closing low of 42.62. The February 4 closing low was the bottom of the previous 2010 pullback and previous 2010 YTD closing low. QQQQ plunged downwards through this uptrend line on Flash Crash Thursday, May 7. QQQQ has now remained below since Friday, May 14.

Lower Uptrend Line
The lower yellow uptrend line, a rate of price ascent, is from the March 9, 2009 closing low of 25.74 up through the June 9, 2010 closing low of 43.82. The June 9 closing low had been the bottom of this most recent pullback until June 29 when QQQQ gapped down below.

Downtrend Line
The yellow downtrend line, a rate of price descent, is from the October 31, 2007 peak closing high of 55.03 down through the April 23, 2010 closing high of 50.52, the peak YTD closing high so far. QQQQ has remained below this downtrend line subsequently.

Long Term Downtrend Line
The lavender downtrend line, a rate of price descent, is from the March 27, 2000 all-time adjusted closing high of 114.30 down through the April 23, 2010 closing high of 500.52, the peak YTD closing high so far. QQQQ has remained well below this downtrend line subsequently.

Relative Strength Index (RSI)
RSI 14 day = 32.19 is oversold and higher than the YTD low of 9.31 on July 6
RSI 28 day = 46.68 is leaning oversold and higher than the YTD low of 35.45 on June 9
Both the RSI 14 and 28 day are off the YTD lows with plenty of upside.

MACD (12,26,9)
The MACD flipped to bearish on June 29 and is now uptrending. The MACD at +0.36 on June 18 had been the highest since July 24, 2009 at +.37.

Long-Term Trend
The 10 month exponential moving average of 44.06 is a long-term indicator and shown on the monthly chart below. That is the line in the sand, so to speak, for the long term signal of a bull or bear market. QQQQ dipped below in June but now has rallied back above. QQQQ had previously remained above since April 2009.

Conclusion
QQQQ set a 2010 YTD high on April 23 and then was pulled down by the overall market downdraft caused initially by the European Crisis and then the recent disappointing USA economic data. The overall market has been volatile, so high beta QQQQ is bouncing up and down accordingly. The technology sector Q1 revenues, earnings, and outlook were very good. We now await the beginning of earnings season on Monday, which may well make or break QQQQ  along with the overall USA equities markets.

I remain "cautiously bullish" on QQQQ in 2010 and still predict there will be more 2010 YTD highs. Both the RSI 14d 28d are off the YTD lows. The MACD is bearish but uptrending. The intermediate-term trend remains bearish however as significant price damage has occurred on this pullback. The long-term trend is now tenuously bullish.


QQQQ Monthly Chart

Below is the monthly QQQQ chart since January 2005 for a long-term perspective. The overall analysis and commentary are the same as for the daily chart above. The yellow horizontal line, the current price, plus the yellow downtrend and uptrend lines and the lavender downtrend line are the same, and as described, on the daily chart above. The white moving average line is the 10 month exponential moving average, which is the long-term bull or bear market signal, as discussed above with the daily chart.


QQQQ ETF Portfolio Holdings
The NASDAQ 100 Index includes 100 of the largest domestic and international nonfinancial companies listed on the Nasdaq Stock Market based on market capitalization. The QQQQ will, under most circumstances consist of all the stocks in the Index. The QQQQ portfolio is rebalanced quarterly and reconstituted annually.. The Powershares QQQQ portfolio holdings are here. QQQQ is heavily weighted to the Information Technology sector (63.15%), Consumer Discretionary sector (14.49%), and Health Care sector (15.01%). Those 3 sectors comprise 92.65% of the entire portfolio. Therefore, the QQQQ is a technology weighted, nonfinancial Index and related ETF with a significant holding in high beta stocks. Also, Apple Inc., AAPL, is the most heavily weighted stock in QQQQ at 19.76% and is reviewed in detail here.


Disclosure
We are long AAPL which is in the QQQQ portfolio, but do not have any long or short position in QQQQ stock.


Follow OspreyFlyer On Twitter!


^v^ ^v^ ^v^

Seeking Alpha

Amazon!